3D and animated maps
Click to enlarge the interactive model !
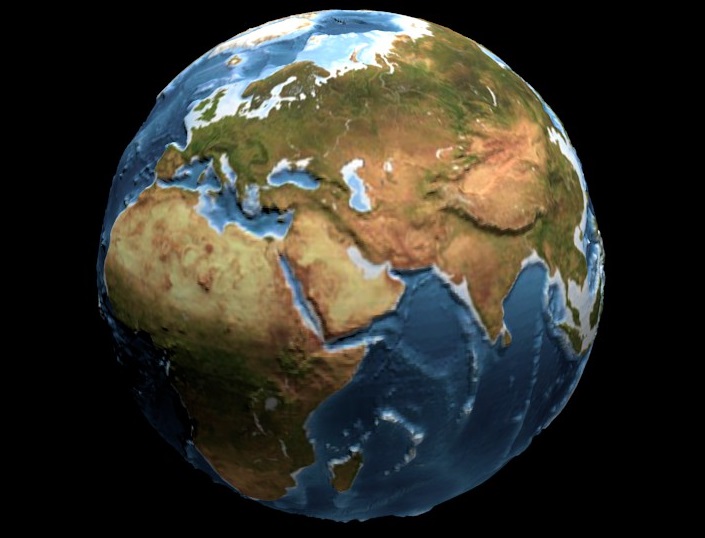
Globe: 3D interactive geographical globe.
Click to enlarge the interactive model !
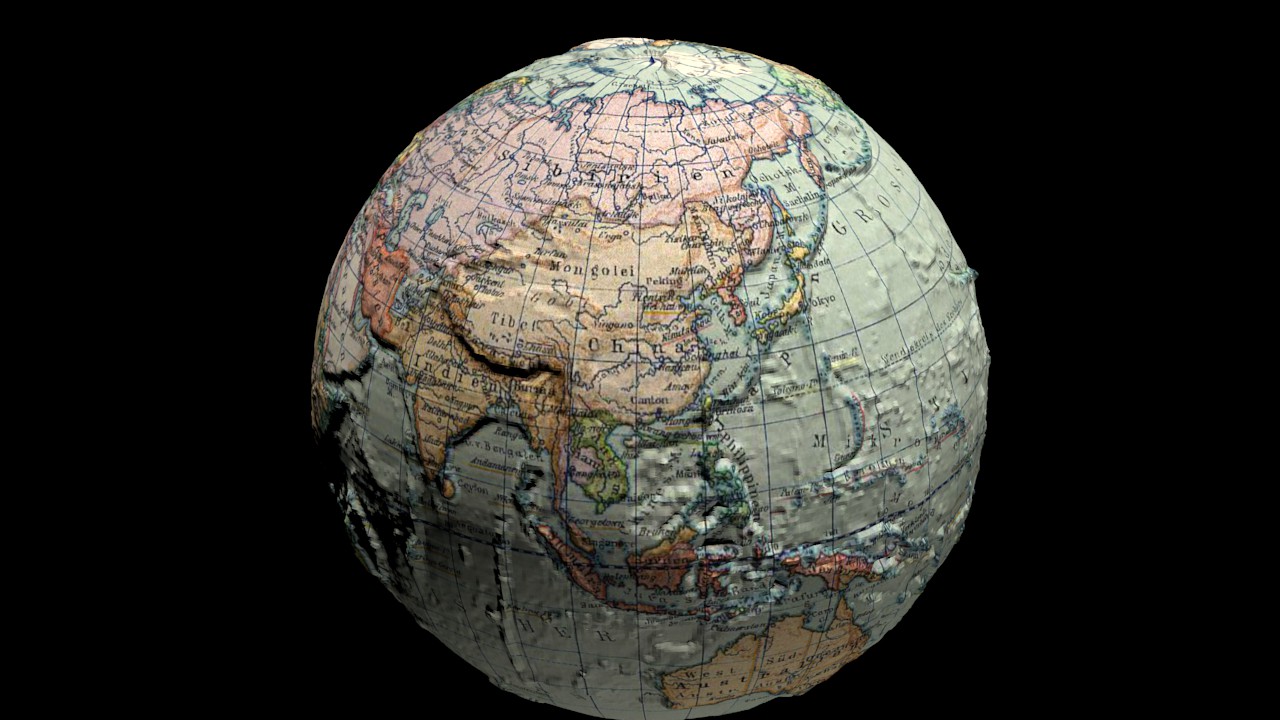
Blobe: 3D interactive historical political globe.
Click to enlarge the interactive model !

Model: 3D surface of South Amerika and the continent plates.
Click to enlarge the interactive model !
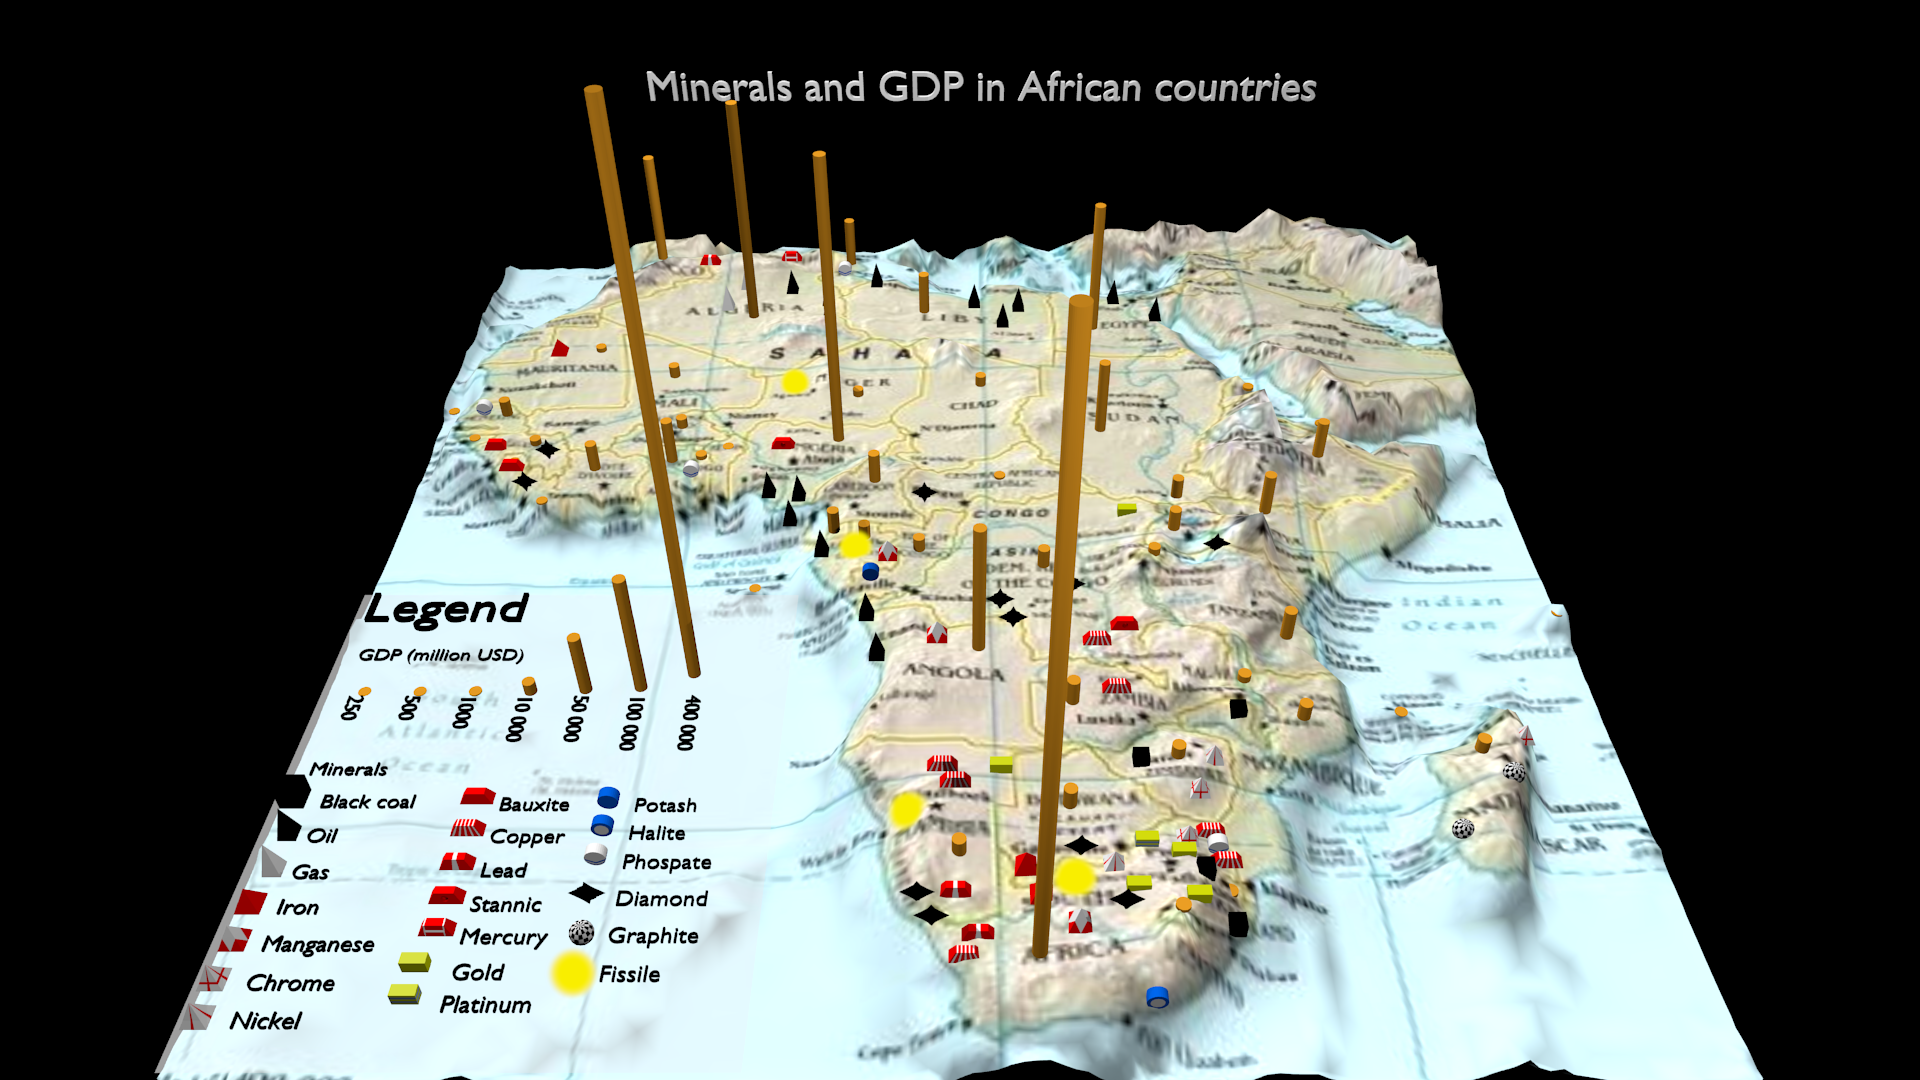
Model: The GDP and minerals in African countries
Map: Interior migration in Hungary, static map. The height of columns shows the
number of migrated people. If the columnsare under the plane of the country,
the migra-tion is negative, if they are above, they a
re positive.
The map is animated, the viewpoint
sight is moving above and below the horizon
Map:Average precipitation in three periods by meteorological models, dynamic map.
The average precipitation in one month produ
ces a 3D relief. This
relief moves (up and
down) as the monthly values change.
We can see three periods together, so the rates can be
compared
Map:Average precipitationin one period
Map:Ocean currents, dynamic map. The li
nes represent the way of flowing water,
and
the spheres follow them showin
g the direction. The map is animated, the earth rotates.
Map: Mining in Hungary, dynamic map. The map shows three dates: 1962, 1986, and
2007.
Between these dates the 3D pictograms appear and disappear
(changing by the
transparency) as the mines close or open
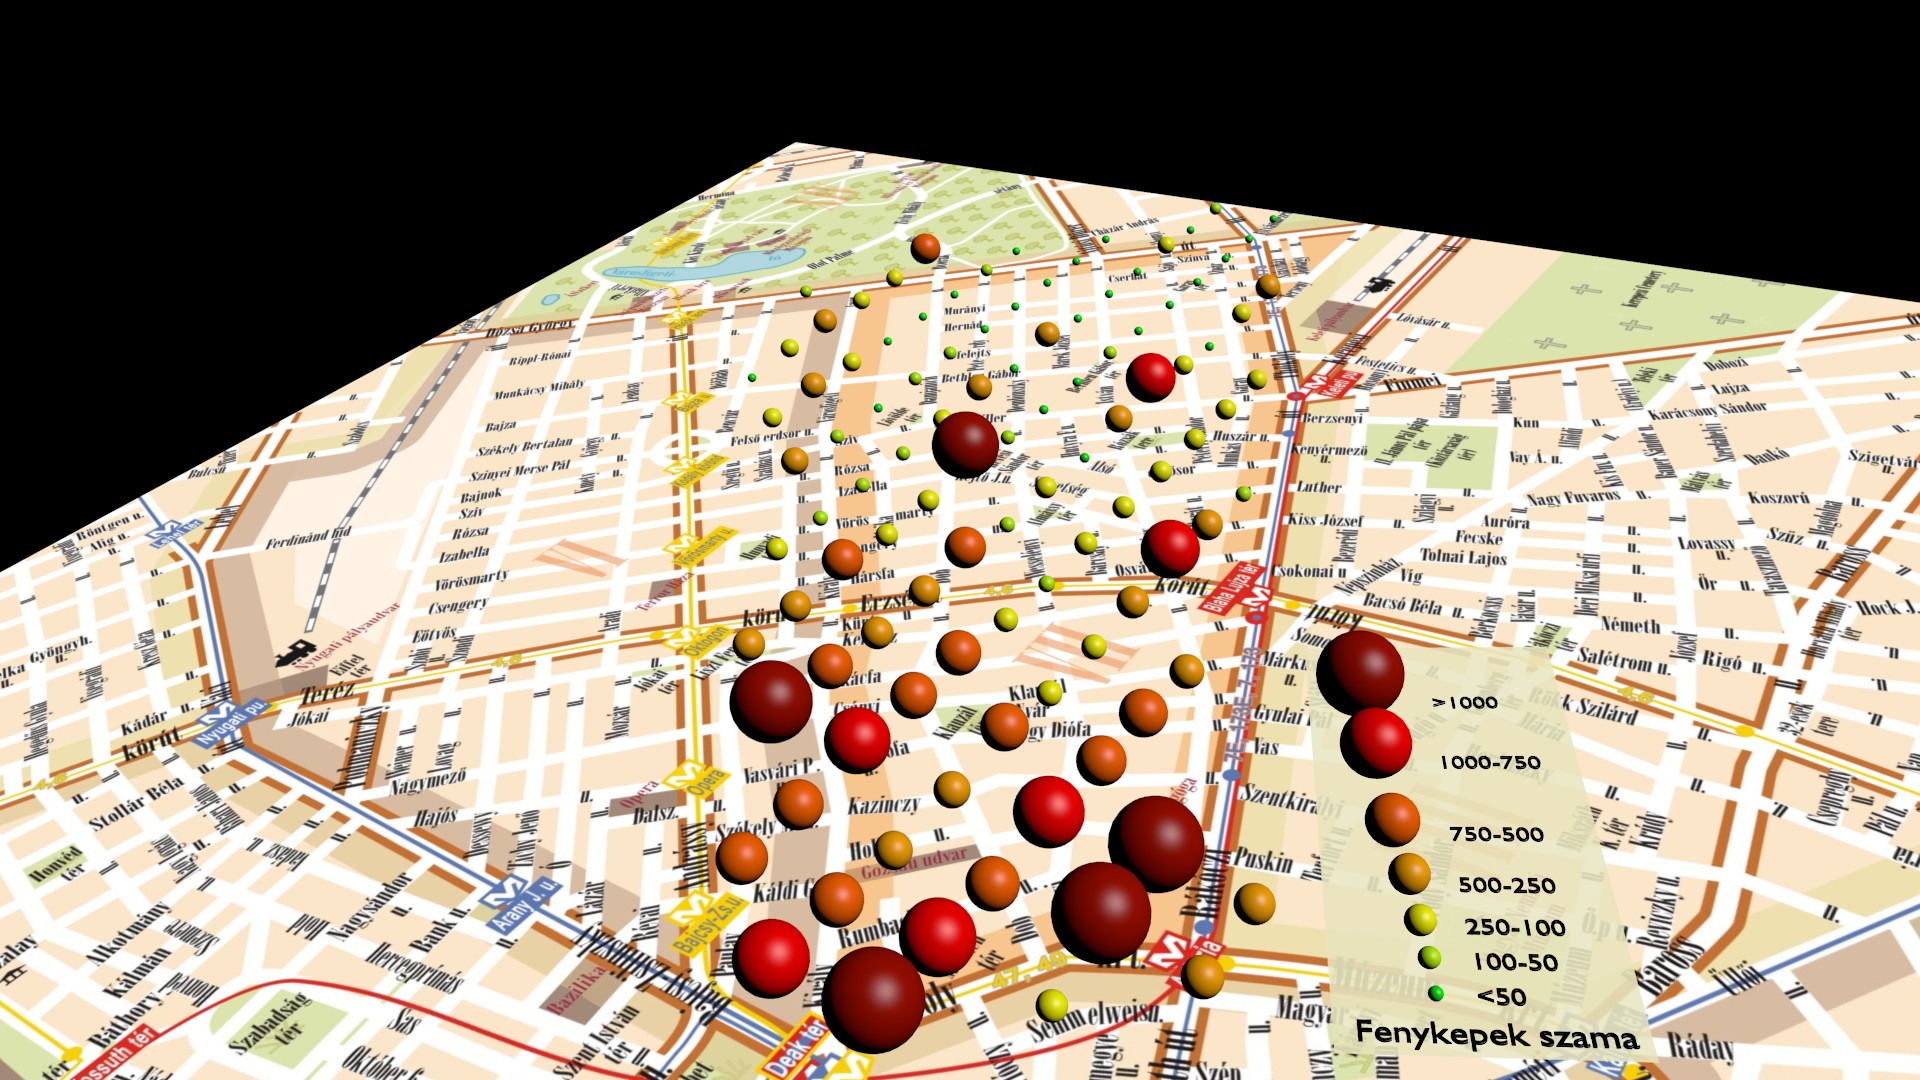
Map: Pictures of the tourists in the 7th district.
Map: GPS satellites. Yellow: USA-Navstar. Red: Russia-Glonass, Green: China- Beidou. Blue: Japan-QZSS
Click to enlarge the interactive model !
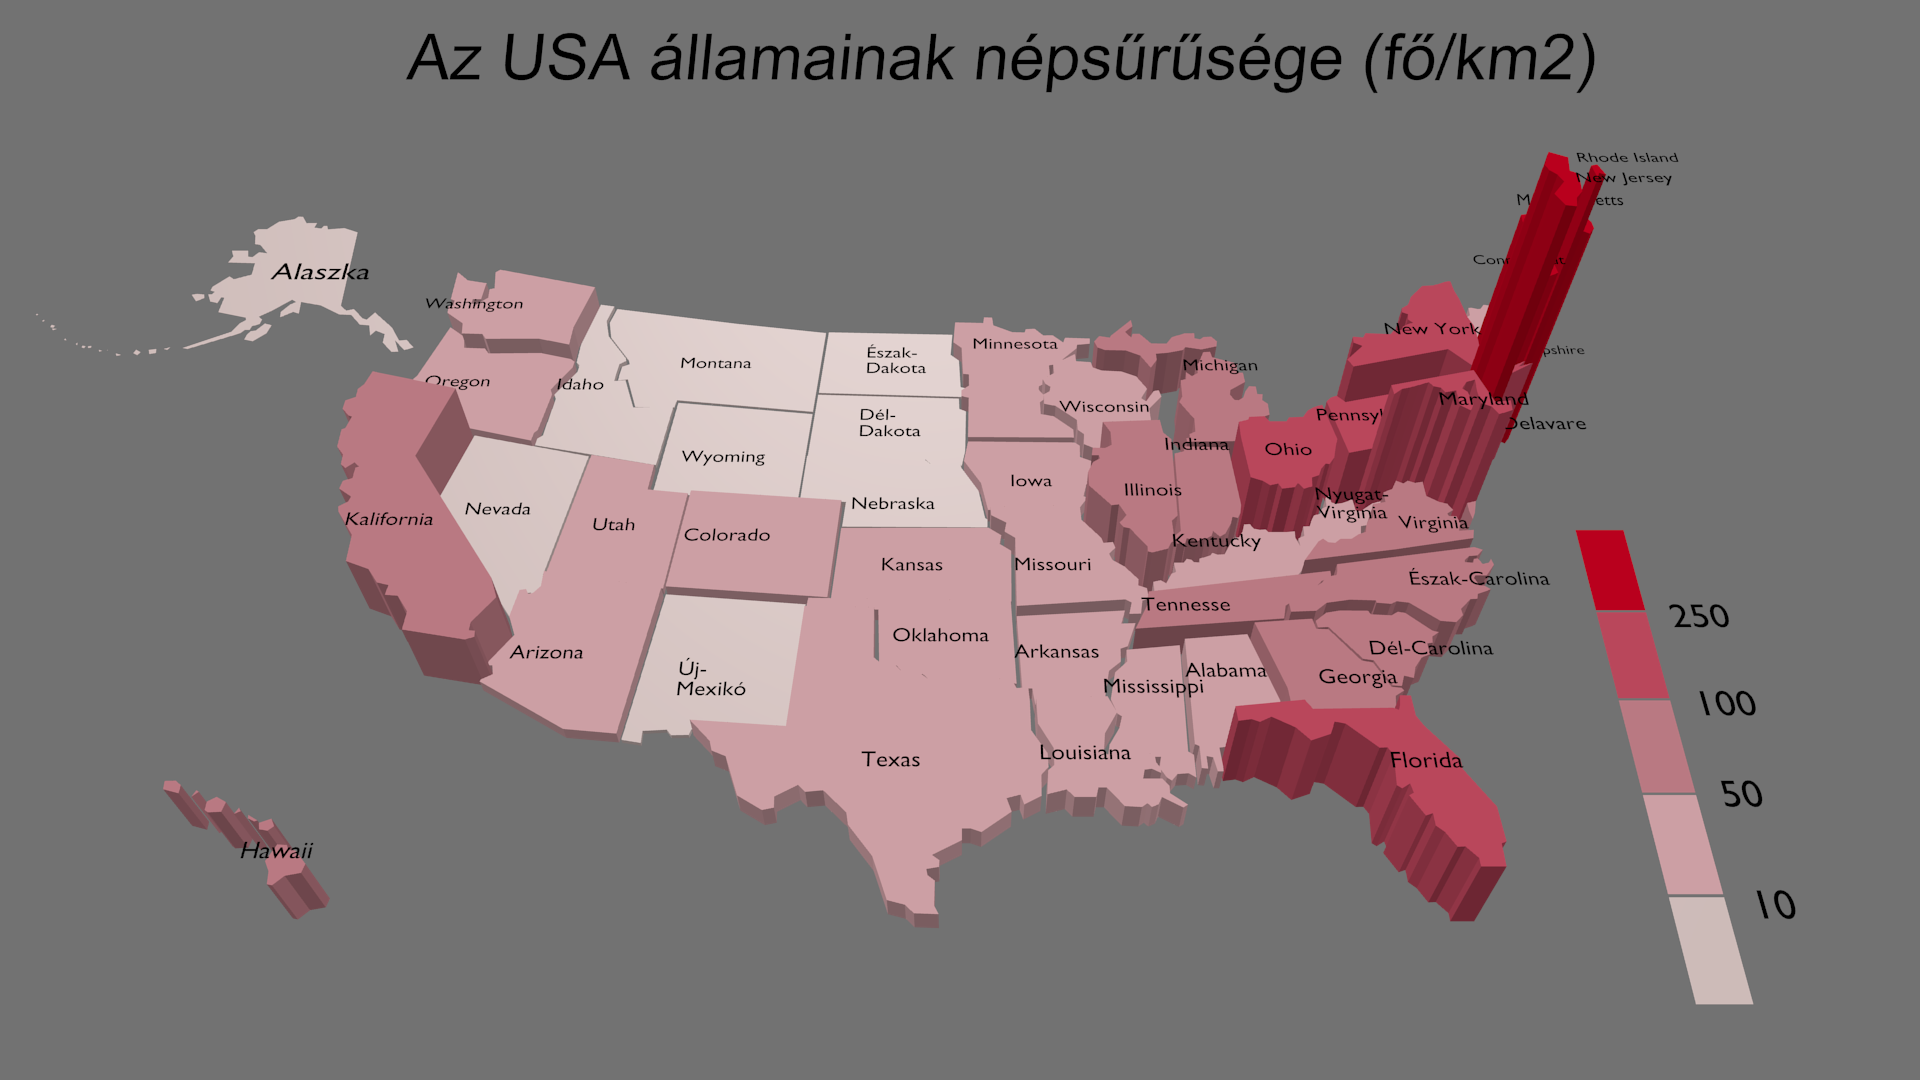
Map: Population density in United States
Click to enlarge the interactive model !
Map: Changes in the poultry stock in Hungary between 2001 and 2007, dynamic map.
The height of chickens are growing and decreasing
Changes the beef stock in Hungary between 2000 and 2009
Changes the pork stock in Hungary between 2000 and 2009
Changes the sheep stock in Hungary between 2000 and 2009
Map: The financial support of state universities, 2008-2013
(financial supprt is 2008= 100%)
Map: Financial support of state universities in billion forint
Click to enlarge the interactive model !
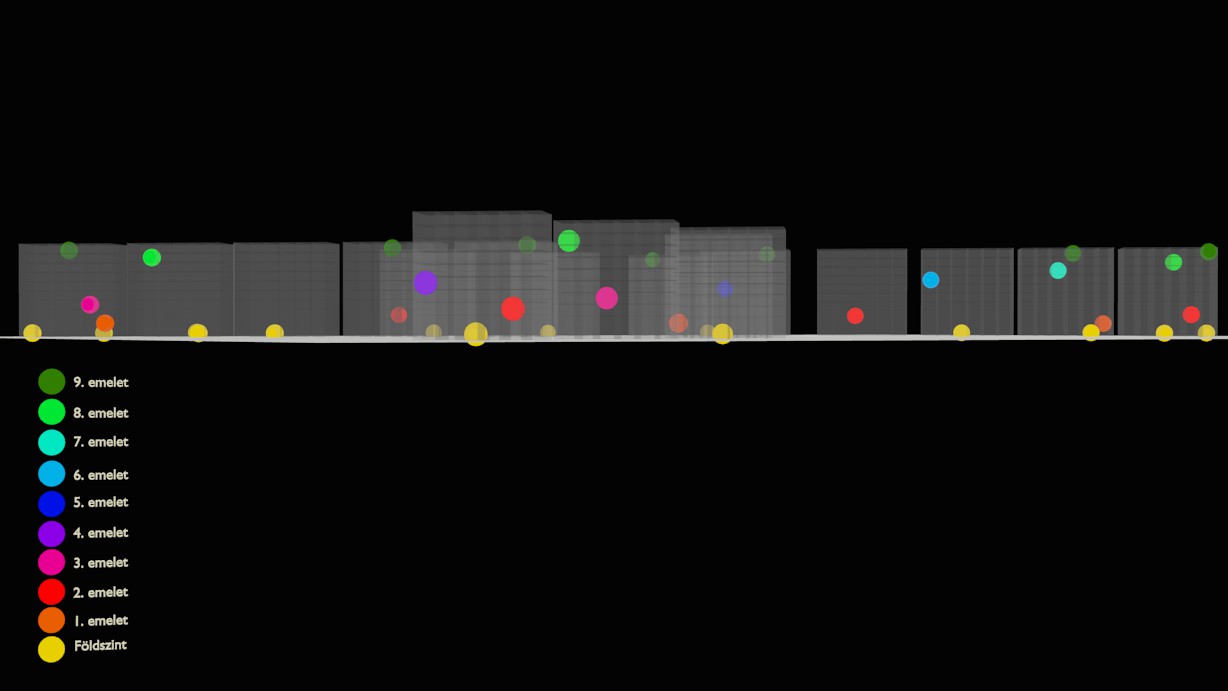
Map: Burglaries in block of flats, static map. The spheres represent
irrupted flats.
The
houses are transparent for better obs
ervation. The dates are fictitious